Lesson 2: Benefits of Optimal Preterm Nutrition in the Neonatal Intensive Care Unit (NICU)
2.2 Growth
Ideally, the growth of a preterm infant would match the intrauterine (IU) growth pattern of a fetus of the same gestational age (GA).To reproduce this growth in the extrauterine environment requires firstly establishing what the goals for growth are.Then figuring out the types and amounts of nutrients to be given to preterm infants, either enterally or parenterally, or both.
Since fetuses cannot directly be measured and weighed, the first curves attempting to describe IU growth were developed in the 1960s, based on recorded birthweights of over 5000 infants born between 24-42 weeks (Ehrenkranz 2014). These curves also gave rise to the nomenclature "small,” "appropriate,” or "large” for gestational age (SGA, AGA, LGA), defined as <10th, 10th-90th, and >90th percentile for weight, respectively. Factors limiting the reliability of birthweight-derived growth curves include inaccurately determined gestational ages and the possibility that some preterm births are related to an unfavorable intrauterine environment, which could cause intrauterine growth restriction (IUGR) (Ehrenkranz 2014). Since the introduction of these first growth curves, many other birthweight-derived population-based curves have been developed. Two recently-developed fetal growth curves that incorporate anthropometric measurements from thousands to several million infants are: the Fenton and Kim preterm infant growth chart (Fenton & Kim 2013), which updates a 2003 chart by Fenton and incorporates 2006 WHO Growth Standards (WHO 2006) for the post-term section; and charts from the Pediatrix Medical Group, which combine IU growth curves by Olsen et al. 2010 and WHO-CDC growth charts (Grummer-Strawn et al. 2010). These recent charts track weight, length, and head circumference from 22-50 and 23-50 weeks' GA, respectively, along sex-specific curves. The Fenton and Kim growth charts and several age calculators are available for free download in multiple languages and various formats here. The Pediatrix Medical Group charts can be found here.
Use of fetal growth curves has been standard in neonatal intensive care units for the last half-century. In the future, these growth curves are likely to be replaced by prescriptive international standards for how fetuses and newborns should grow. The INTERGROWTH-21st Project (Villar et al. 2013) has collected data from a total of over 50,000 pregnant women and their newborns from 8 countries around the world and has produced prescriptive growth standards from early pregnancy to infancy. Thirty-five percent of these women were eligible to be enrolled in the Newborn Cross-Sectional Study (NCSS) aiming to produce newborn standards for birthweight, length and head circumference (Villar et al. 2014). The Fetal Growth Longitudinal Study (FGLS) enrolled almost 5000 women, who were ultrasound scanned from 14 weeks of gestation until birth to produce fetal anthropometric measurements (Papageorghiou et al. 2014). To construct either fetal or newborn standards, only data from the prescriptive subpopulation was included, meaning women with an adequate health and nutritional status who were at low risk of intrauterine growth restriction.
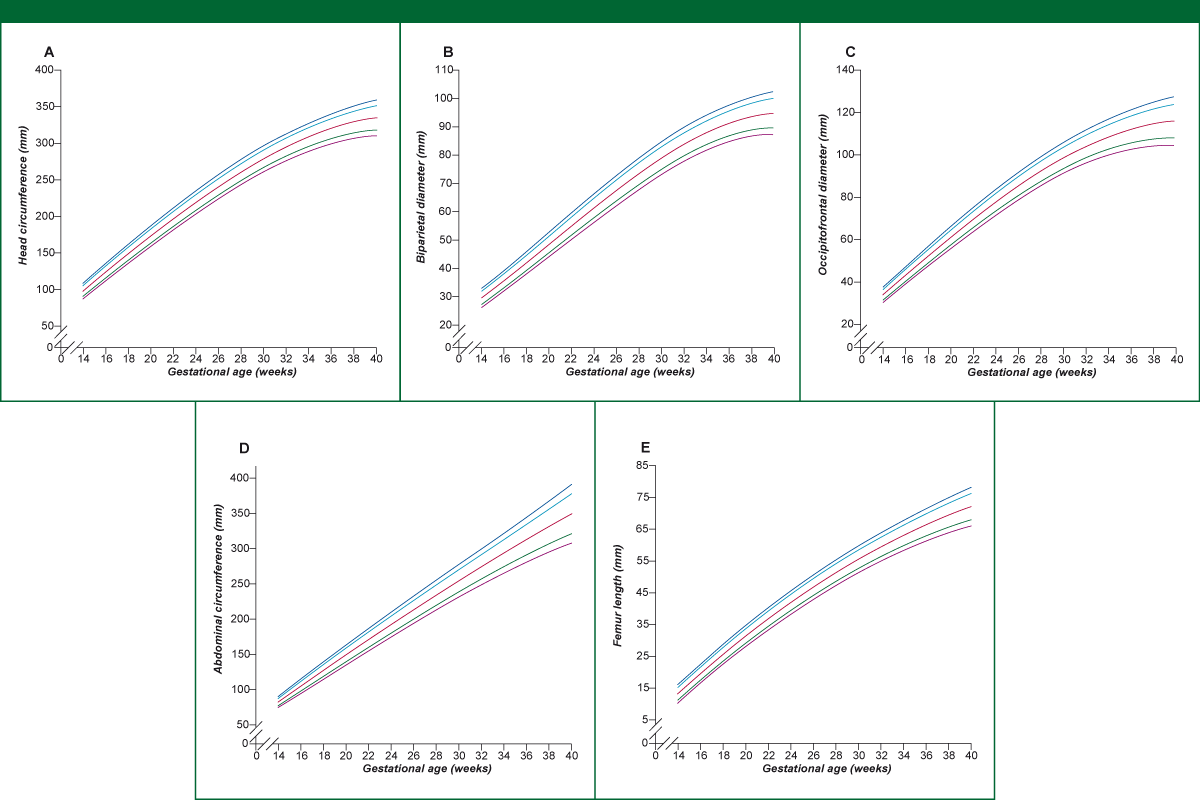
Figure 5. 3rd, 10th, 50th, 90th and 97th smoothed centile curves for fetal growth based on the FGLS study.
Source: Papageorghiou et al. 2014
Legend: Fetal head circumference (A), fetal biparietal diameter (B), fetal occipitofrontal diameter (C), fetal abdominal circumference (D), and fetal femur length (E) measured by ultrasound according to gestational age.
Tracking preterm infants with the available charts has consistently shown that their growth is reduced when compared to normal intrauterine growth. This is especially true for the smallest infants. Although only 17% of ELBW infants are born SGA, the vast majority of ELBW infants have growth faltering, also called extrauterine growth retardation (EUGR), by 36 weeks' post-menstrual age (Poindexter 2014). Rates of EUGR in ELBW infants have shown some improvement over the past 20 years, but they are still very high.

Figure 6: Incidence of postnatal growth failure in extremely premature infants at 36 weeks' PMA
(reported by the Eunice Kennedy Shriver Neonatal Research Network)
Source: Poindexter 2014; reprinted with kind permission of S. Karger AG, Switzerland